Fractional odds explained
First off the fractional odds,f.o=a/b are simple to calculate and also f.o figures determine profit as ( a linear) function of stake
These figures can be understudied in many ways
One is next: The denominator(b) is the amount bet and the numerator(a) is the amount that your wager will yield
- a/b ‘a’ to ‘b’ against if a>b or worse than evens
- 1-1 evens odds if b=a
- a/b ‘b’ to ‘a’ on (or in favur) if b>a better than evens
Example:
7/2 ….. seven to two against( Whom? punter of cause)
if we stake 2€ then the profit will be 7€ in the winning case
2/7 …. two to seven in favor
stake 7€ will produce 2€ of profit
Tiny deeper insight
a)against case
4/2
meaning: for investing every 2€ we got 4€ of profit
revenue: 4+2=6 ) of wage follow 1 € ($) profit!
So we have got:(stake=)1 +(profit=)1 = (revenue=)2
2=stake(=1)*d.o => d.o=2
So when we notice in the betting offer that the victory of, for example, the home team is odds=2, then the bookmaker gives a 50% chance of winning that very team
How does it d.o=2 work in the field?
To answer that, let’s dive into one of my databases with 116 739 played games in the period 2005-2020 taken from the source Football-Data.co.uk
Decimal odds 2.00 of 1/1 in fractional form is provided by Bet365

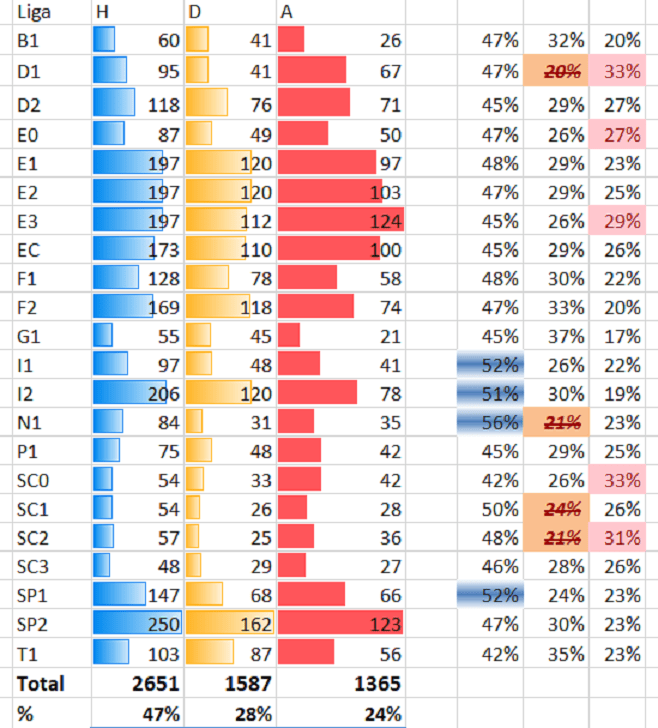
As presented in 116 739 records has 2651+1587+1365=3 603 those with even odds
Well, in 15 years even odds took place 3603/116739 =0.0309= 3.09%
in that amount, home winning is 47% for the same period, almost even-50%
Top four order:
1. N1- Eredivisie 56% home winning with even odds, d,o(H)=2
2. I1 –Serie A 52%
3. SP1-LaLiga 52%
4. I2 –Serie B 51%
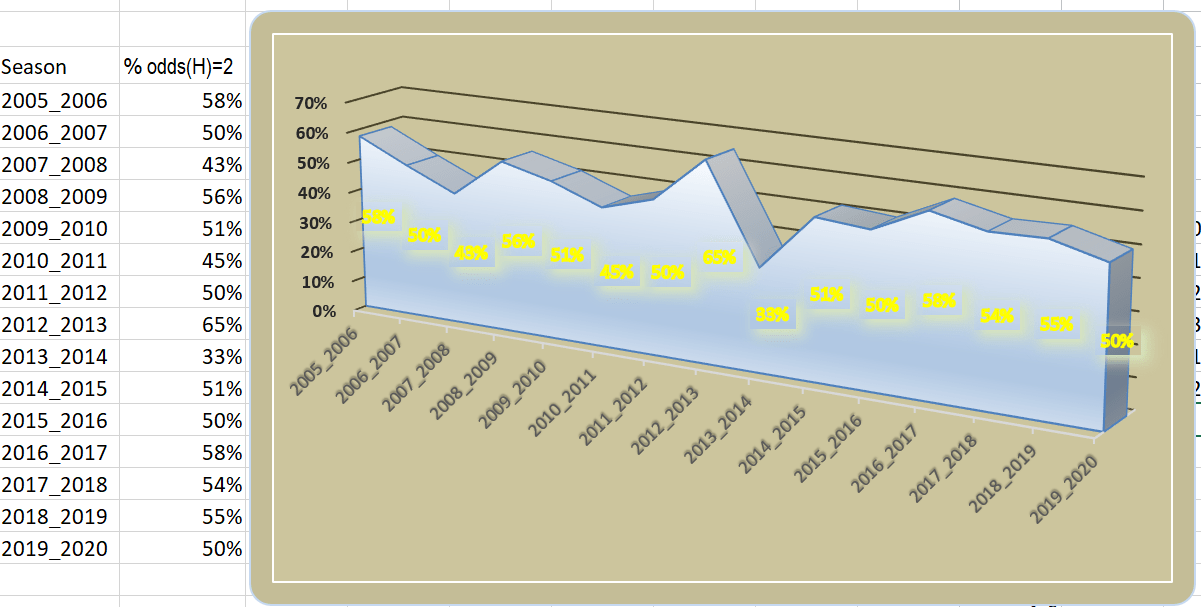
In the graph below, as an example is singled out Seria A

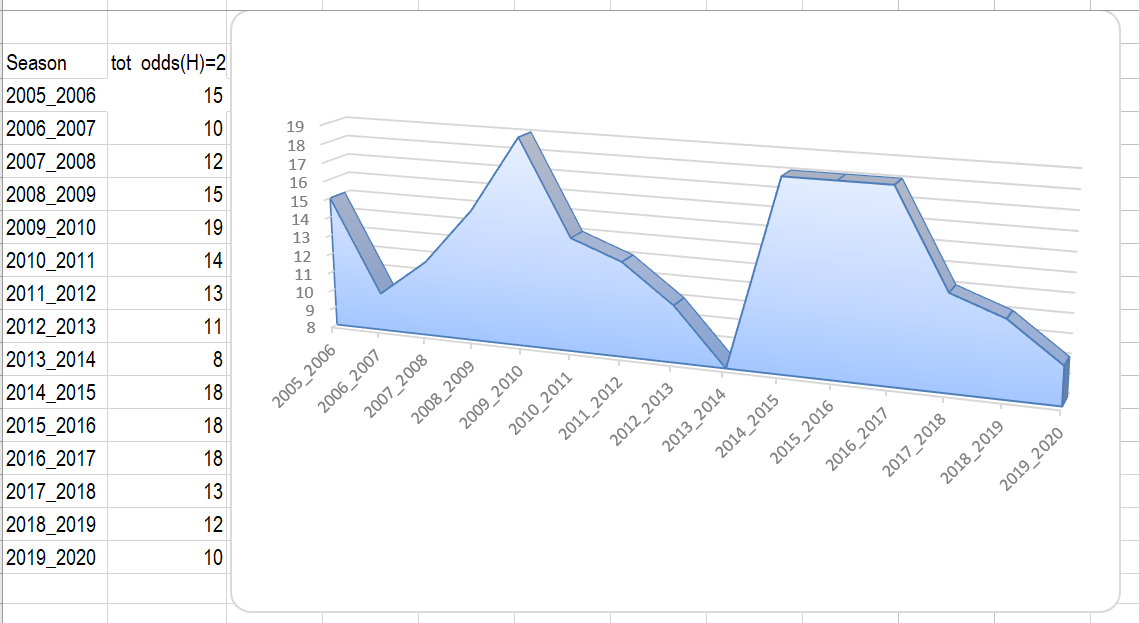
The below curve is basically the same as the curve above
The only difference is that natural numbers replace the averages
The aleatory nature of the game is clearly reflected
